The data culture debt
Every transformation process starts by wondering about the starting point. When it comes to decision science, one must keep in mind that some people are culturally not really used to managing their operations using data & analytics insights. It doesn’t mean they can’t use it, it means the way to present and to use data & analytics insight has to be designed in such way that it encompasses inherits habits whilst deriving and conducting a new way of working.
Design a computation model that shift the user perspective
Computation models are tricky: people always knows its business better than ourselves. However, we better know how to turn his experience and business insights into data science models that serve its predefined purpose
Epilogi®, A&P guidance softwate use case
Recreating how humans think
For a global company with several brands (10+) in the cheese industry, produced and distributed in more than 20 countries across the globe. Every year, the global marketing team must define what A&P budget should every country receive to support maximum global performance in its yearly activities.
This maximum global performance aims at maximizing profit and supporting mid-term of long-term brand and/or market performance. The allocation process goes as following :
- Every country is assigned a role to play to support the global strategy.
- A global A&P budget is defined at the group level…
- … and then the global team must split it between different countries.
This process used to be supported by some KPIs (net sales margin, market shares…) but was mostly done using experience or beliefs from the people around the table.
Obviously, in those conditions, it was difficult to get closer to optimization : every country is a different market, and is influenced by many drivers that are predicable, unpredictable, or unknown.
Challenges to face
One can propose the most relevant data analysis and push recommendations, but it will not be enough. Here are some of the reason why:
- The statistician curse: the interlocutor doesn’t really understand what’s behind the data science, and is left alone.
- The factory and the foreman: the results do not support the strategy that the interlocutor had in mind, and he/she rejects it.
- The convenient truth: one might focus more on the on the design of the results presentation, without really displaying the important drivers behind the truth.
Creating decision algorithms with LSTM and gradient boosting
Our objective was to optimize this decision process using the most as possible relevant data analysis. Pivot & Co worked closely with its client to design based on machine learning models what could be the best way to optimise the A&P budget allocation decision of the top management.
The question that lies behind every A&P budget allocation process is how does every country performs when it comes to A&P, and what is the right amount to allocate without jeopardizing the rest of the portfolio?
Consequently, the computation model should be designed to:
- Score every country, and every brand per country, on its A&P performance.
- Based on those scores and on the strategic roles those countries have, generate what could be the best trade-off.
The A&P performance of a country is driven by many different drivers: some are known, some are unknown, some are controllable, and some aren’t.
The scoring model is consequently designed to use a list of internal features (like Net Sales, Sales Margin, A&P budget, innovation rate…) and external features (unemployment rate, retail sales growth…), and to compute what is the impact of each feature on the A&P performance, while accepting some uncertainty (for uncontrollable and unknown drivers).
Using a LSTM machine learning approach and gradient boosting techniques, we were able to train a model that will be able to compute coefficients for every countries and every brands : the correlation between the features and the coefficients will generate final scores
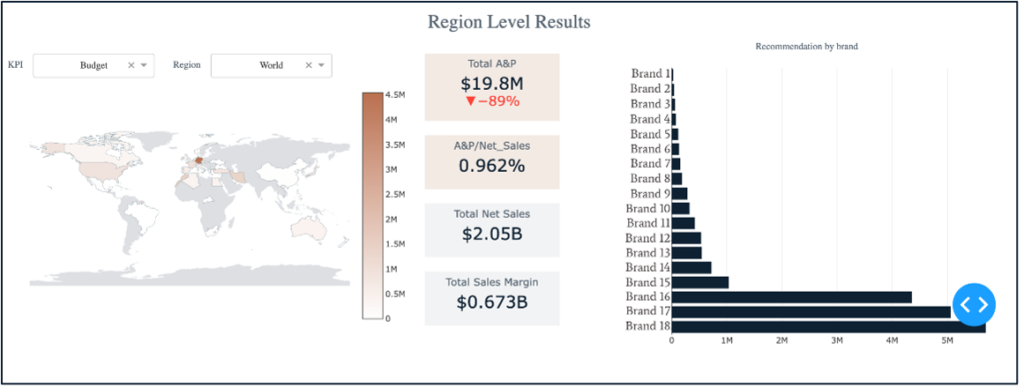
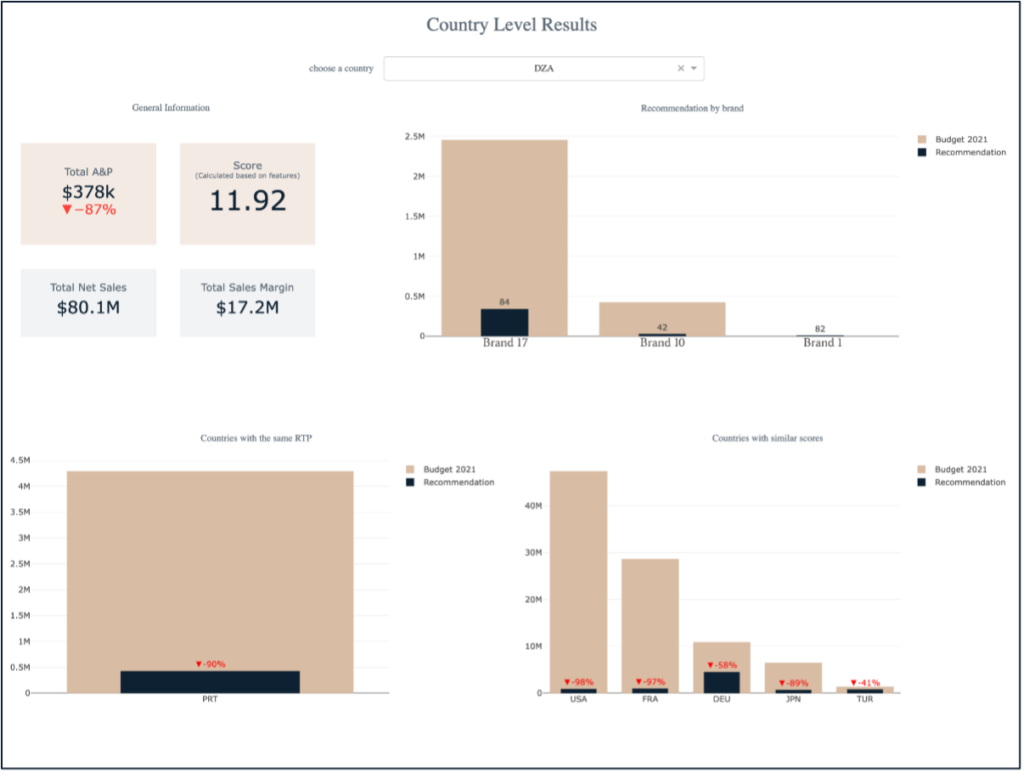
The decision software
The project objective was to allow one user to generate those scores and to receive A&P budget allocation recommendations. To do so, in line with the previous approaches explained, an interactive dashboard has been designed to present the recommendations and allow the user to explore those results.